Research Project
Environmental Justice of Urban Flood Risk and Green Infrastructure Solutions
Team: Timon McPhearson, Christopher Kennedy, Ashish Shrestha, Veronica Olivotto
Past Team Members: Pablo Herreros Cantis, Claudia Tomateo, Elizabeth Cook, Zbigniew Grabowski
Collaborators: Groundwork Hudson Valley, Groundwork USA, Groundwork Milwaukee, WaWa and Eco Action (Atlanta), Healthy Community Services, Hollygrove-Dixon Neighborhood Association and Water Wise Gulf South (New Orleans), Data You Can Use, Milwaukee Water Commons
Sponsor: Kresge Foundation CREWS Program
About the Project

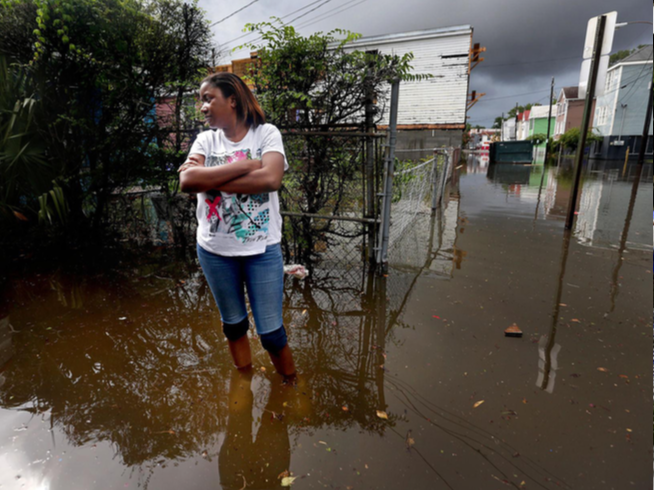
Urban flooding is increasing across the United States as extreme rainfall becomes more frequent and intense. Flood risks are not evenly distributed. In many cities, low-income communities and communities of color experience disproportionate exposure to flooding while also receiving fewer investments in green infrastructure and resilient urban design.
To address these challenges, this research initiative examines how flood risk, infrastructure planning, and social vulnerability intersect in cities across the United States. Led by the Urban Systems Lab, the project combines hydrological modeling, spatial analysis, and community-engaged research to identify which communities face the greatest flood risks and how green infrastructure strategies can reduce those risks while advancing environmental justice.
Through partnerships with community organizations, city agencies, and regional networks, the project provides technical assistance, produces actionable data, maps, and decision-support tools to enhance local planning, advocacy, and decision-making. This work is supported in part by the Kresge Foundation’s Climate Resilient and Equitable Water Systems (CREWS) program.
Background
Urban Flooding and Climate Change
Extreme precipitation is increasing across much of the United States due to climate change. Urban areas are particularly vulnerable because large amounts of impervious surfaces—roads, rooftops, and parking lots—prevent water from infiltrating into the ground.
As rainfall intensity increases, stormwater systems are frequently overwhelmed, leading to:
street flooding
basement flooding and sewer backups
combined sewer overflows
damage to homes and infrastructure
These risks are often compounded in neighborhoods with aging infrastructure, limited green space, and historic disinvestment
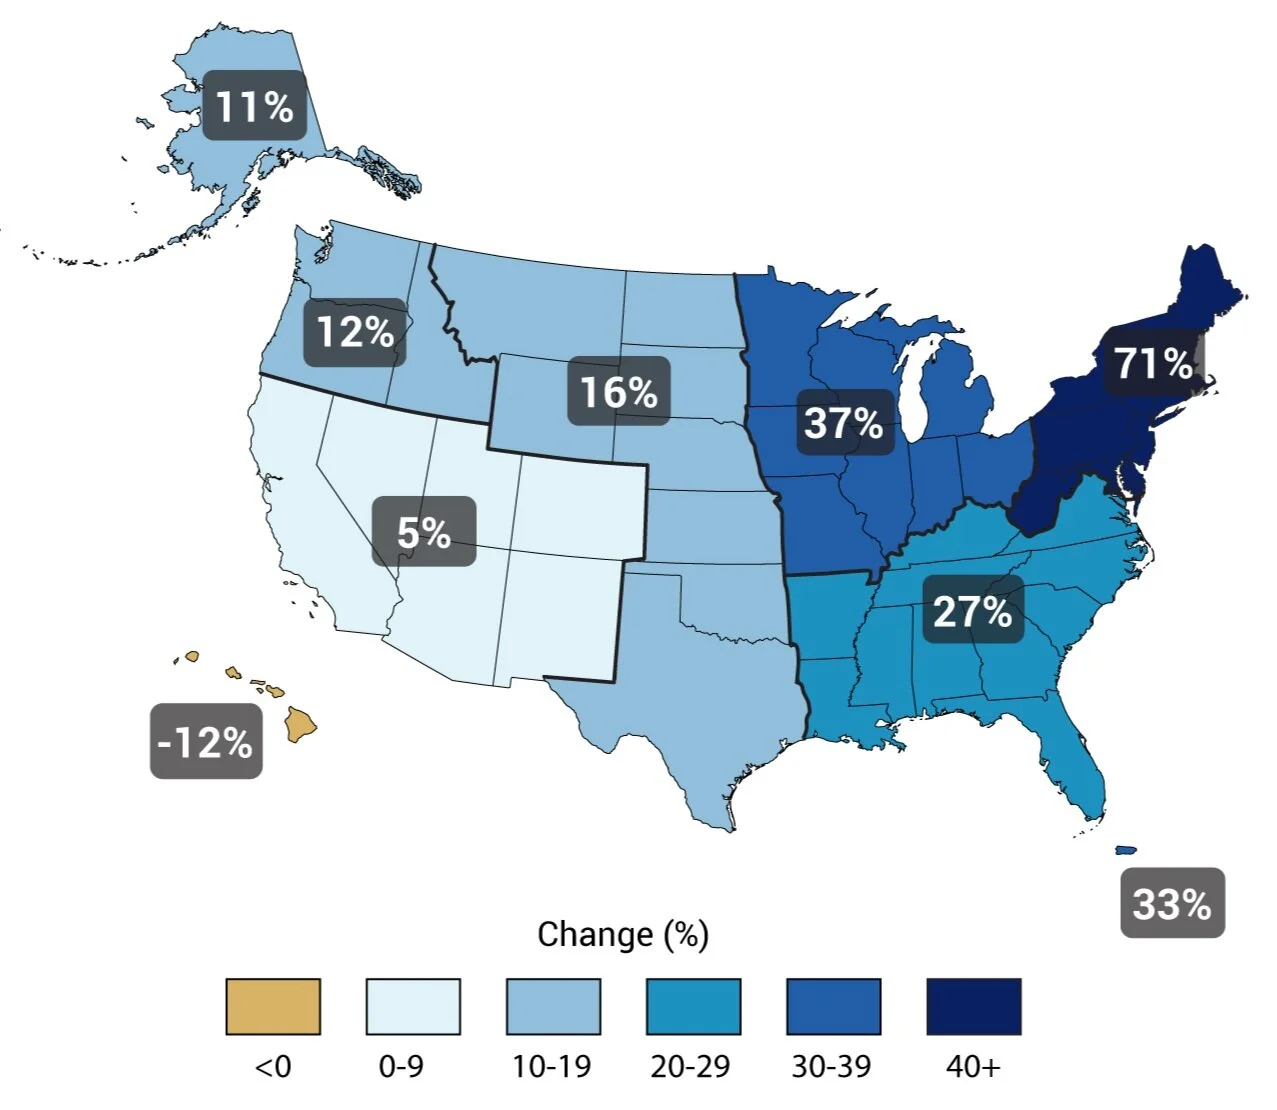
Observed Change in Very Heavy Precipitation. The map shows percent increases in the amount of precipitation falling in very heavy events (defined as the heaviest 1% of all daily events) from 1958 to 2012 for each region of the continental United States. These trends are larger than natural variations for the Northeast, Midwest, Puerto Rico, Southeast, Great Plains, and Alaska. The trends are not larger than natural variations for the Southwest, Hawai‘i, and the Northwest. The changes shown in this figure are calculated from the beginning and end points of the trends for 1958 to 2012. (Figure source: updated from Karl et al. 2009).
Green Infrastructure as a Flood Solution
Green infrastructure is emerging as a powerful tool to mitigate the risks posed by stormwater in a decentralized manner. Green infrastructure can be used to retain or slow down stormwater so that the load on sewer systems is reduced, lowering the risk of combined sewer overflows.
There are many ways to plan and design green infrastructure, as well as many ways to define it. While it can be used to deliver a wide variety of benefits, such as providing shade on hot days, or green spaces for communities to gather, green infrastructure is most commonly defined as a tool for stormwater management. Examples include:
rain gardens
bioswales
permeable pavements
tree canopy and urban forests
wetlands and green corridors
While GI is increasingly used in cities to manage stormwater and improve water quality, its benefits are not always distributed equitably. In many cases, investments prioritize downtown districts or redevelopment areas rather than neighborhoods facing the highest flood risks.
Environmental Justice and Flood Risk
Flood risk is not evenly distributed across cities. Some neighborhoods are more prone to flooding due to factors such as impervious surfaces, topography, and drainage capacity, which influence how water moves through urban environments. As a result, communities experience different levels of flood exposure depending on where they are located.
Communities also differ in their ability to prepare for, respond to, and recover from flooding. Social factors such as income, age, housing conditions, and access to healthcare influence vulnerability to flood impacts. Environmental injustice occurs when socially vulnerable communities and communities of color face disproportionate exposure to flood hazards. Historical and systemic factors, including redlining and unequal investment in infrastructure and green space, have contributed to these disparities.
In addition, decisions about where and how green infrastructure is implemented can either reduce or reinforce these inequalities. Ensuring that flood mitigation investments prioritize vulnerable communities is therefore critical for advancing equitable climate resilience.
Research Goals
The project focuses on several core research questions:
Who is most exposed to urban flooding?
How does flood risk intersect with social vulnerability?
Where are green infrastructure investments currently prioritized?
How could alternative planning strategies better serve vulnerable communities?
To address these questions, the project develops a framework for analyzing environmental justice in urban flood risk and green infrastructure planning. The aim is to provide decision-ready information that cities and community organizations can use to design flood mitigation strategies that are both effective and equitable.
Methods and Tools
The research integrates hydrological modeling, spatial analysis, and community collaboration.
Flood Risk Modeling
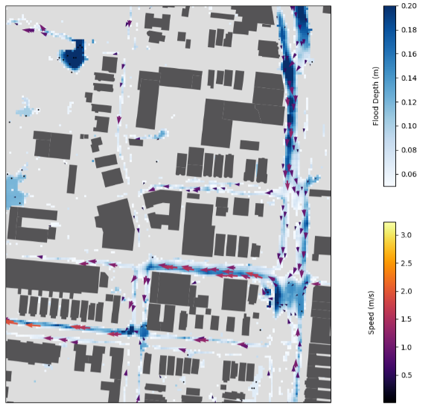
Flood risk is simulated using physics-based hydrodynamic models such as CityCAT. These models simulate rainfall events and map flood depths and flow paths across urban landscapes.
Social Vulnerability Analysis
Flood exposure maps are combined with indicators of social vulnerability, including data on:
income and poverty
race and ethnicity
age and disability
housing conditions
access to transportation
This analysis helps identify where flood risks and social vulnerabilities overlap.
Community-led Co-Production
Community input is essential to validating models and understanding flooding that may not appear in official datasets. Residents contribute observations, photographs, and lived experiences of flooding.
Visualization and Communication
Results are translated into accessible tools such as:
• maps and visualizations
• interactive story maps
• technical reports
• community-facing materials
Mapping current flood risk to explore how different scenarios of green infrastructure distribution would change


Sample Flood Modeling in Elizabeth, NJ
City Collaborators and Projects

Yonkers, New York
Collaboration start: 2019
Primary location: Yonkers, NY
Collaborator: Groundwork Hudson Valley
The Urban Systems Lab began collaborating with Groundwork Hudson Valley to analyze urban flooding and green infrastructure opportunities in Yonkers, a city with steep terrain, aging infrastructure, and recurring runoff flooding during intense rainfall events.
Using hydrodynamic flood modeling and spatial analysis, the project examined how stormwater moves through urban landscapes and where flooding is most likely to occur. The work also evaluated how proposed green infrastructure investments could reduce flood risk in vulnerable areas, particularly near public housing and community assets.

This research contributed to feasibility studies for green infrastructure interventions and provided data that community organizations and local stakeholders could use to advocate for flood mitigation investments.
Project deliverables
Hydrodynamic flood simulations for 10-year and 100-year storm events
Flood depth and flood extent maps for priority locations in Yonkers
Spatial analysis of flood exposure and social vulnerability
Technical input supporting green infrastructure feasibility studies
City factsheet summarizing flood risk and environmental justice findings
Data and mapping resources used by Groundwork Hudson Valley for community engagement and planning
Milwaukee, Wisconsin

Collaboration start: 2020
Primary location: Milwaukee, WI
Collaborators: Groundwork Milwaukee, Data You Can Use, Milwaukee Water Commons
In Milwaukee, the Urban Systems Lab collaborated with community organizations and civic data partners to develop the Milwaukee Flood Health Vulnerability Assessment (MFHVA), an analytical tool that identifies areas where exposure to flooding intersects with health, housing, and socioeconomic vulnerabilities.


The research integrated hydrological flood modeling with spatial datasets related to public health, social vulnerability, and environmental conditions. The resulting assessment provides a clearer understanding of how flooding risks compound with existing inequities in Milwaukee, a city with a long history of segregation and uneven infrastructure investment.
The tool supports Groundwork Milwaukee’s Climate Safe Neighborhoods initiative and provides information that can inform community advocacy, public health planning, and municipal infrastructure investment.
Recent work expanded the analysis to explore the relationship between flooding and contaminated brownfield sites, highlighting additional risks faced by vulnerable communities when flooding mobilizes environmental contaminants.
Project deliverables
Citywide flood risk analysis integrating social and health vulnerability indicators
Interactive story map and visualization tools
Technical report describing methods and results
Spatial datasets identifying priority areas for equitable flood mitigation
Maps and graphics used by community organizations for advocacy and planning


Syracuse, New York
Collaboration start: 2019
Primary location: Syracuse, NY
Collaborators: Local stakeholders and CREWS network organizations
Research in Syracuse examined how urban flood risk intersects with social vulnerability and how green infrastructure planning decisions influence the distribution of benefits across neighborhoods.


The analysis evaluated the city’s Save the Rain green infrastructure program, which was originally designed to reduce combined sewer overflows and improve water quality. The research explored how green infrastructure investments could also address flood risk while prioritizing neighborhoods experiencing greater vulnerability.
Using hydrodynamic flood modeling and spatial analysis, the team mapped flood exposure across the city and compared it with demographic and socioeconomic indicators to identify communities facing disproportionate impacts.
Project deliverables
hydrological and flood risk modeling
ArcGIS StoryMap exploring flood risk and environmental justice in Syracuse

Elizabeth, New Jersey


Collaboration start: 2019
Primary location: Elizabeth, NJ
Collaborators: Jersey Water Works, New Jersey Future, Ironbound Community Corporation, Future City Inc.
In Elizabeth, the Urban Systems Lab analyzed flood risks associated with the city’s combined sewer system and contributed to discussions around the city’s Long Term Control Plan (LTCP) for reducing combined sewer overflows.
The research examined how planned infrastructure investments could affect flood risk and environmental justice outcomes in vulnerable neighborhoods. The project also provided technical comments and recommendations related to equity considerations in the LTCP planning process.
Project deliverables
Hydrodynamic flood modeling of stormwater and sewer system interactions
Spatial analysis of flood exposure across census block groups
Policy comments and recommendations on Elizabeth’s Long Term Control Plan
City factsheet summarizing flood risk and environmental justice consideration
New York City, New York
Collaboration start: 2022
Primary location: Northern Manhattan (Harlem and Washington Heights)
Collaborator: WE ACT for Environmental Justice
The Urban Systems Lab collaborated with WE ACT to support analysis for the Climate Ready Uptown Plan, a community-driven climate adaptation initiative focused on Northern Manhattan.
The work contributed research and technical support related to climate risks affecting historically marginalized communities, including flooding, heat, and coastal hazards. The collaboration emphasized integrating community knowledge with climate science and spatial analysis to inform equitable climate adaptation planning.
Project deliverables
Climate risk and vulnerability analyses for Northern Manhattan
Data and visualizations supporting Climate Ready Uptown Plan
Contributions to community-informed climate adaptation strategies
Technical inputs supporting equitable climate resilience policy discussions
Atlanta, Georgia
Collaboration start: 2023
Primary location: Atlanta metropolitan region
Collaborators: West Atlanta Watershed Alliance, Eco-Action, Atlanta Regional Commission, Georgia State University
More recent work expanded the research initiative to Atlanta, where flooding increasingly affects neighborhoods facing historic disinvestment and environmental inequities.
The Atlanta pilot study integrates flood risk modeling with community knowledge to better understand how stormwater infrastructure, land use change, and climate-driven rainfall patterns contribute to flooding in vulnerable communities.
The project aims to support local organizations and regional planning efforts by providing data and tools that inform equitable climate adaptation strategies.
Project deliverables
Pilot hydrological and flood risk modeling for Atlanta neighborhoods
Spatial analysis linking flood exposure with social vulnerability indicators
Maps and visualizations supporting community advocacy and regional planning
Research outputs demonstrating scalable methods for equitable climate adaptation
New Orleans, Louisiana
Collaboration start: 2024
Primary locations: Algiers (Orleans Parish) and Hollygrove–Dixon neighborhood
Collaborators: Healthy Community Services, Hollygrove–Dixon Neighborhood Association, Water Wise Gulf South
The Urban Systems Lab recently expanded this research initiative to New Orleans to examine how extreme rainfall, drainage infrastructure, and neighborhood-scale hydrology contribute to localized nuisance flooding. Working with community collaborators, the project integrates hydrological modeling, spatial analysis, and resident observations to better understand where flooding occurs and how stormwater moves through neighborhood streets and drainage systems.
Initial work focuses on two areas: Algiers, where modeling supports planning for the proposed Regenerative Stormwater Research and Training Institute, and the Hollygrove–Dixon neighborhood, where residents report frequent flooding during moderate rainfall events. The research combines community-sourced flooding observations and flood risk perceptions with technical modeling to identify flood pathways, drainage limitations, and opportunities for green infrastructure and stormwater improvements that can support more equitable flood mitigation strategies.
Project deliverables
Neighborhood-scale hydrological flood modeling for frequent rainfall events
Maps identifying flood pathways, accumulation zones, and drainage constraints
Assessment of stormwater infrastructure performance
Identification of priority locations for green and gray infrastructure interventions
Community-facing flood maps and visualizations
Technical report summarizing modeling results and recommendations
Other Products


Work with us!
Do you belong to an organization or city agency who needs technical assistance? We would love to hear from you. Contact us!

This project is supported in part by the Kresge Foundation’s CREWS program.